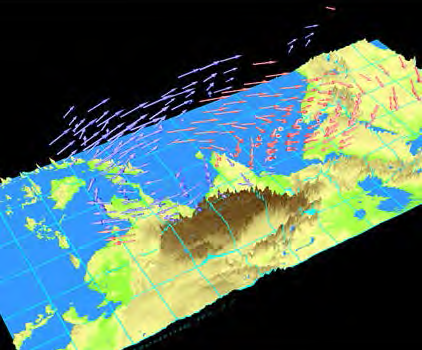
The 3D Data Visualization Analysis Tool is a web-based tool that processes satellite products, reanalysis data, and other 3D data on the server side and displays it in a virtual space. This makes it possible to visually understand the flow of water vapor in weather or monsoon analysis.
How to Use
Account management is carried out individually on a project basis.
Please apply to the address below for access.
